The Currency Market
also known as forex, is a global marketplace where currencies are exchanged, facilitating international trade and investment. The Product trades contracts for difference (CFDs) for major currency pairs like EUR/USD, USD/JPY, and others.
CFDs are financial derivatives allowing traders to speculate on price movements without owning the underlying asset. Traders agree to exchange the difference in price from contract open to close, profiting from market fluctuations. While CFDs involve risks due to leverage, they offer advantages like margin trading and liquidity.
Key advantages of CFDs include:
i) Wide choice of brokers and platforms
ii) Fast execution and reliability
iii) Regulatory oversight for trader protection
iv) Strong customer support
v) Advanced trading tools
Trading platforms are essential for accessing portfolio information and effective trading strategies, featuring real-time charts to monitor trades and outcomes.
In summary, our collaborating Partners provide well-established platforms that grant their clients full visibility over their accounts and trades executed on their behalf based on the investment services to be offered.
These platforms ensure transparency on the investment services offered, which is essential to fostering trust
and confidence among clients.
In currency trading, traders often use "short" and "long" to describe their strategies. A "short" position means they expect a currency pair's value to decrease, so they sell it first to buy it back at a lower price later. Conversely, a "long" position anticipates a currency's value will rise, prompting them to buy the pair to sell at a higher price later.
Traders analyse economic indicators, events, and market sentiment to inform their decisions, while some use technical analysis tools. The currency market's liquidity and volatility attract investors seeking profit from exchange rate fluctuations. Leverage allows traders to control larger positions with less capital, amplifying both profits and losses. However, it also increases trading risk.
When traders use leverage, they borrow funds from their broker to amplify their trading position, with the borrowed funds serving as collateral (known as margin) for the leveraged trade. Brokers often set a maintenance margin requirement to ensure traders can sustain their positions.
Understanding leverage and its risks is crucial before employing it in the currency market. Proper risk management, including the use of stop-loss orders, is essential to mitigate potential losses.

The Strategy is offered with a strict 5% hard stop-loss, which resets monthly to minimize risk. Additionally, leveraged positions are utilized for short periods, with a maximum leverage of 1:20 per currency pair. This leverage may be reduced to 1:4 as the Strategy allocates 1/5th of the capital to each pair, contrary to the typical maximum leverage of 1:30 offered by brokers for major currency pairs.
The Strategy selectively employs leverage based on expert data interpretation to minimize risk and exposure. Decisions are made and executed following a thorough assessment of the data provided by the software model. Below are examples illustrating how the Strategy is implemented.
Long Market Example

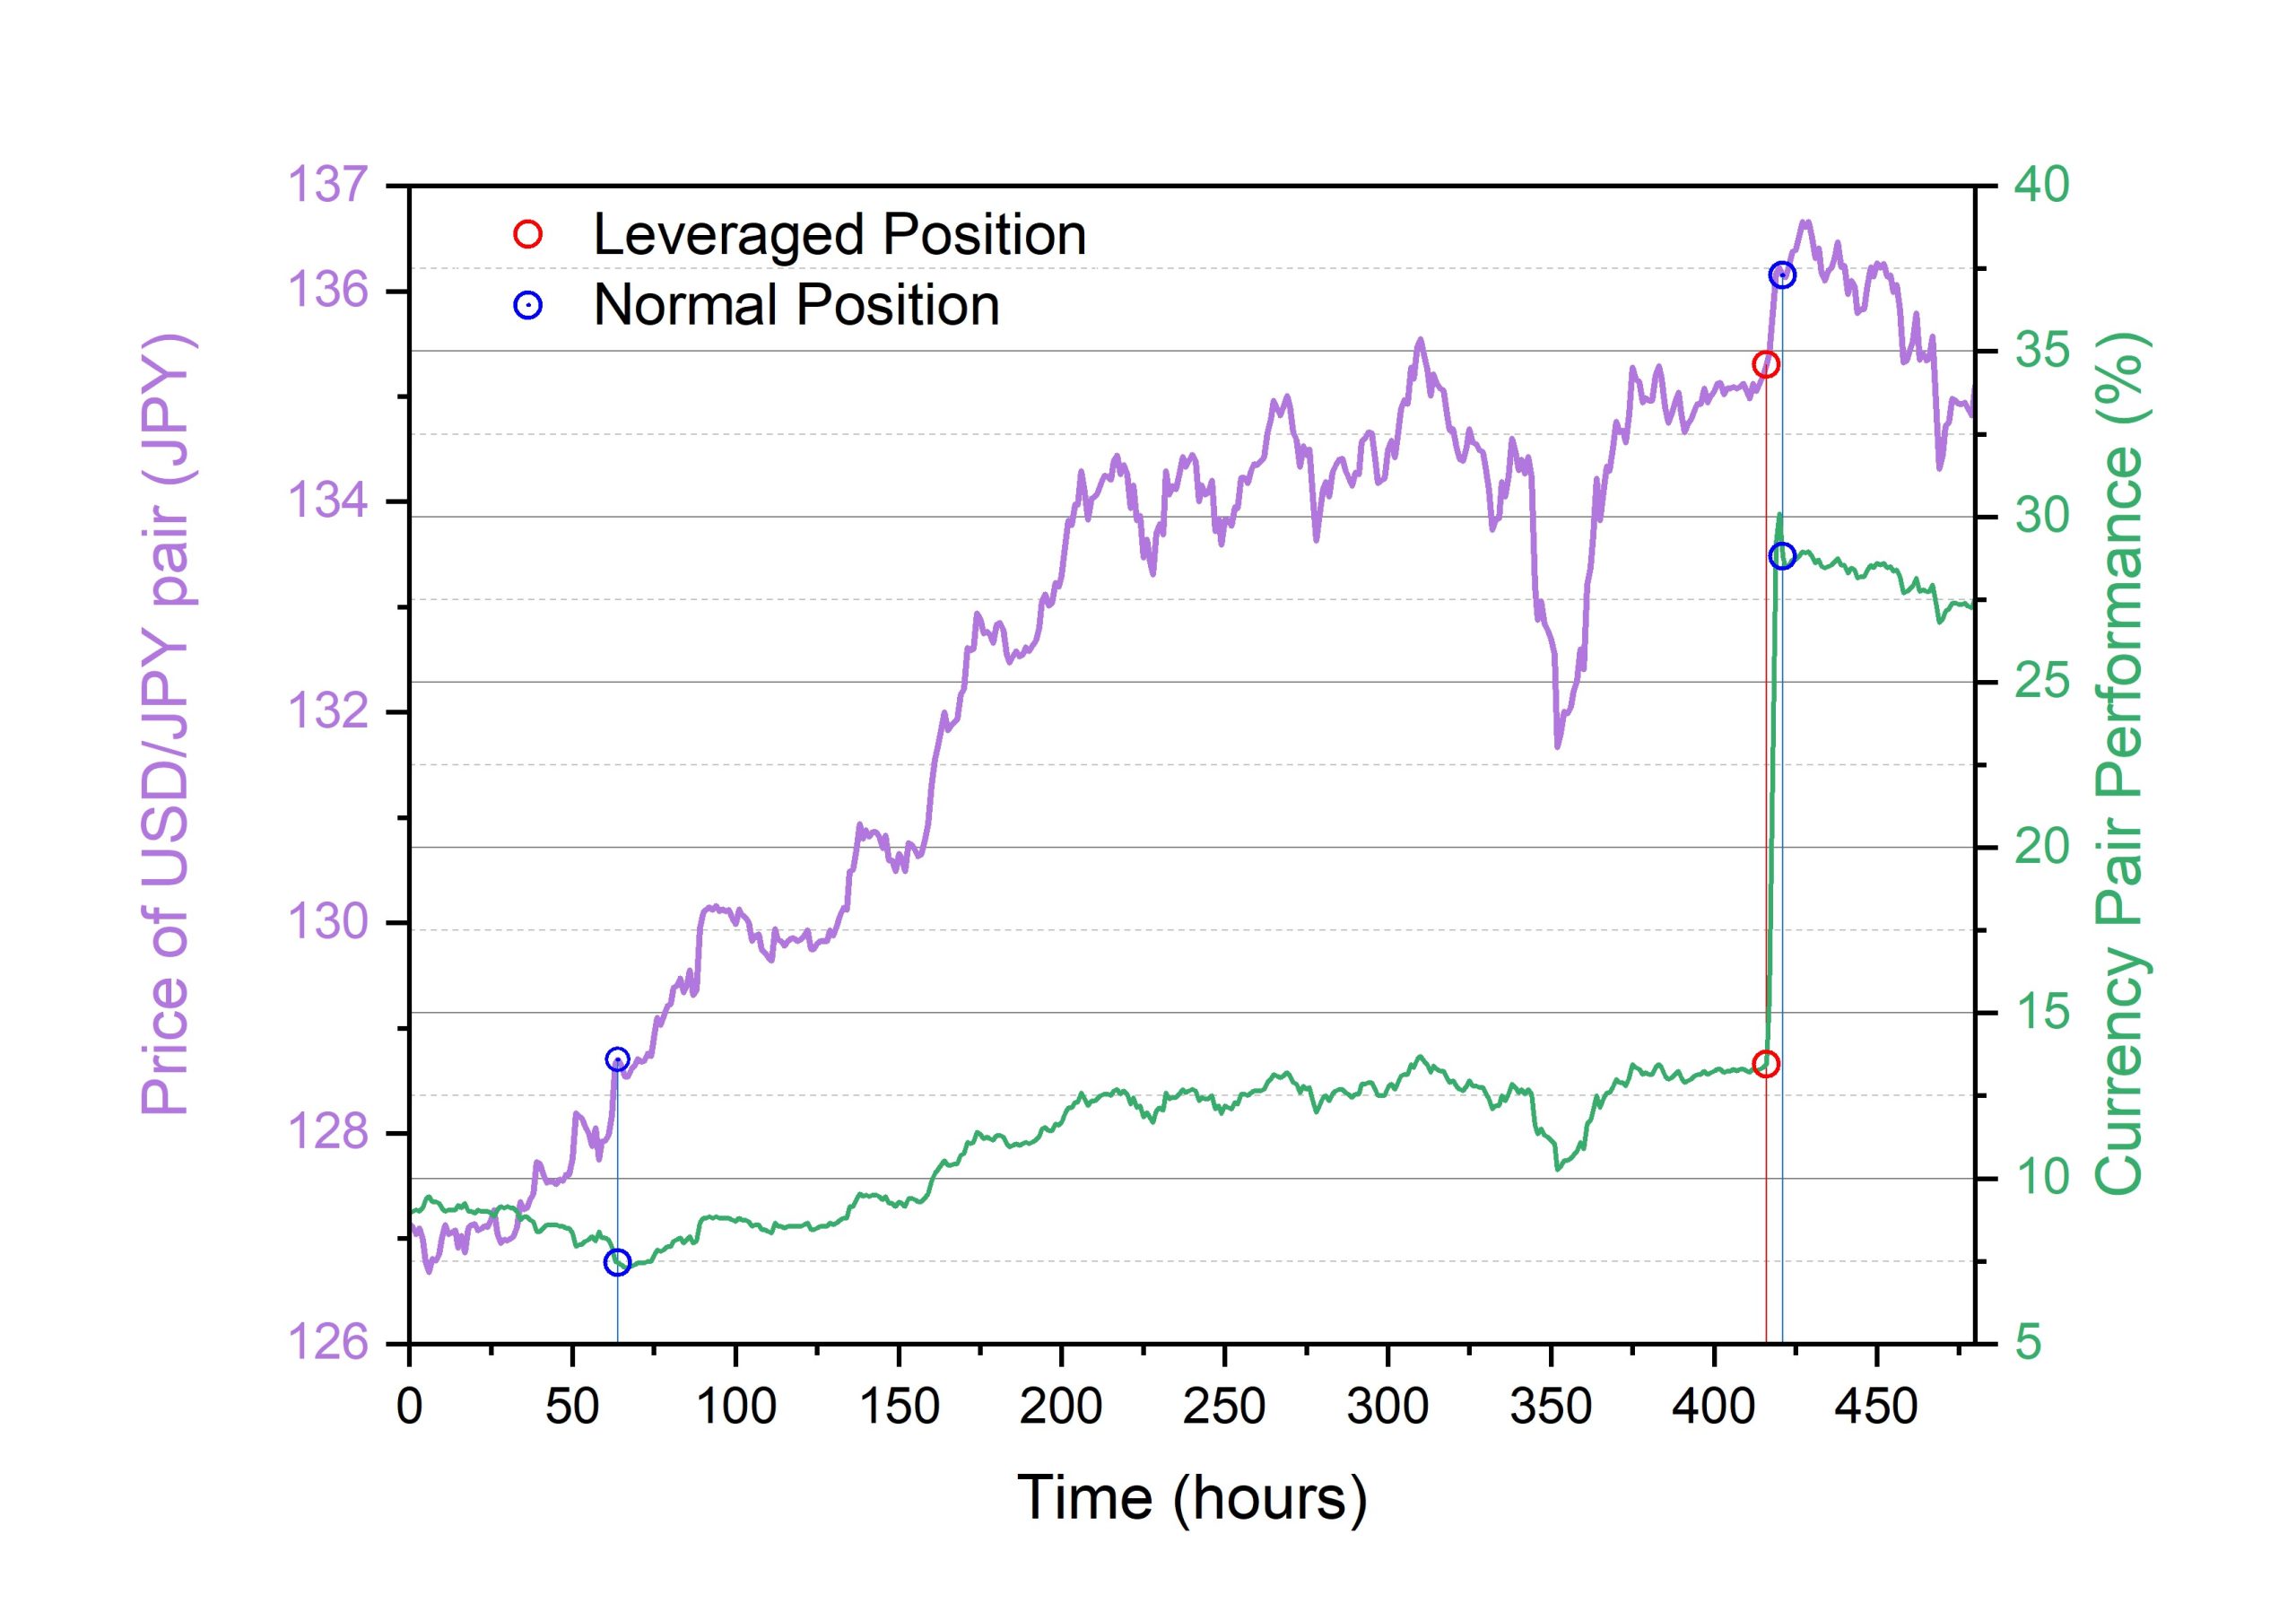
Figure 1: Long” market Example Graph. The price of the USD/JPY pair (Violet Line) and portfolio performance of the pair (Green Line) is presented for a period of 20 days. Normal (1:1) positions are depicted with blue open circles whilst leveraged (1:20) positions are shown with red open circles.
The Graph (Figure 1) shows with a violet line the change of the price of a currency pair, namely the USD/JPY in Yen for a period (~20 days). One can observe the price appreciation of the Japanese Yen over the US Dollar, which implies that the currency pair (aka the phase) goes “long”. In parallel, with a green line, the performance of a portfolio portion (20% of whole portfolio) is depicted. The price oscillates but the general trend is long. The first point (open blue circle) indicates the point where our team decided to change its previous position from “short” to “long”. Evidently this was performed 60 hours after the price started to rise at the expense of our portfolio’s performance and only when the indications from the interpretation directed us to do so. After ~415 hours with the trend on our side and ~12.5% return the conditions had been met to leverage, as the red open circle indicates. At this point our position changed from 1:1 to 1:20 for this currency pair for 3 hours allowing our performance to climb to 30%. The leveraged position then changed back to 1:1 realising a profit ~27% and therefore the overall increase in the portfolio (100% capital) was just over 5% (1/5th of individual currency pair)
Short Market Example
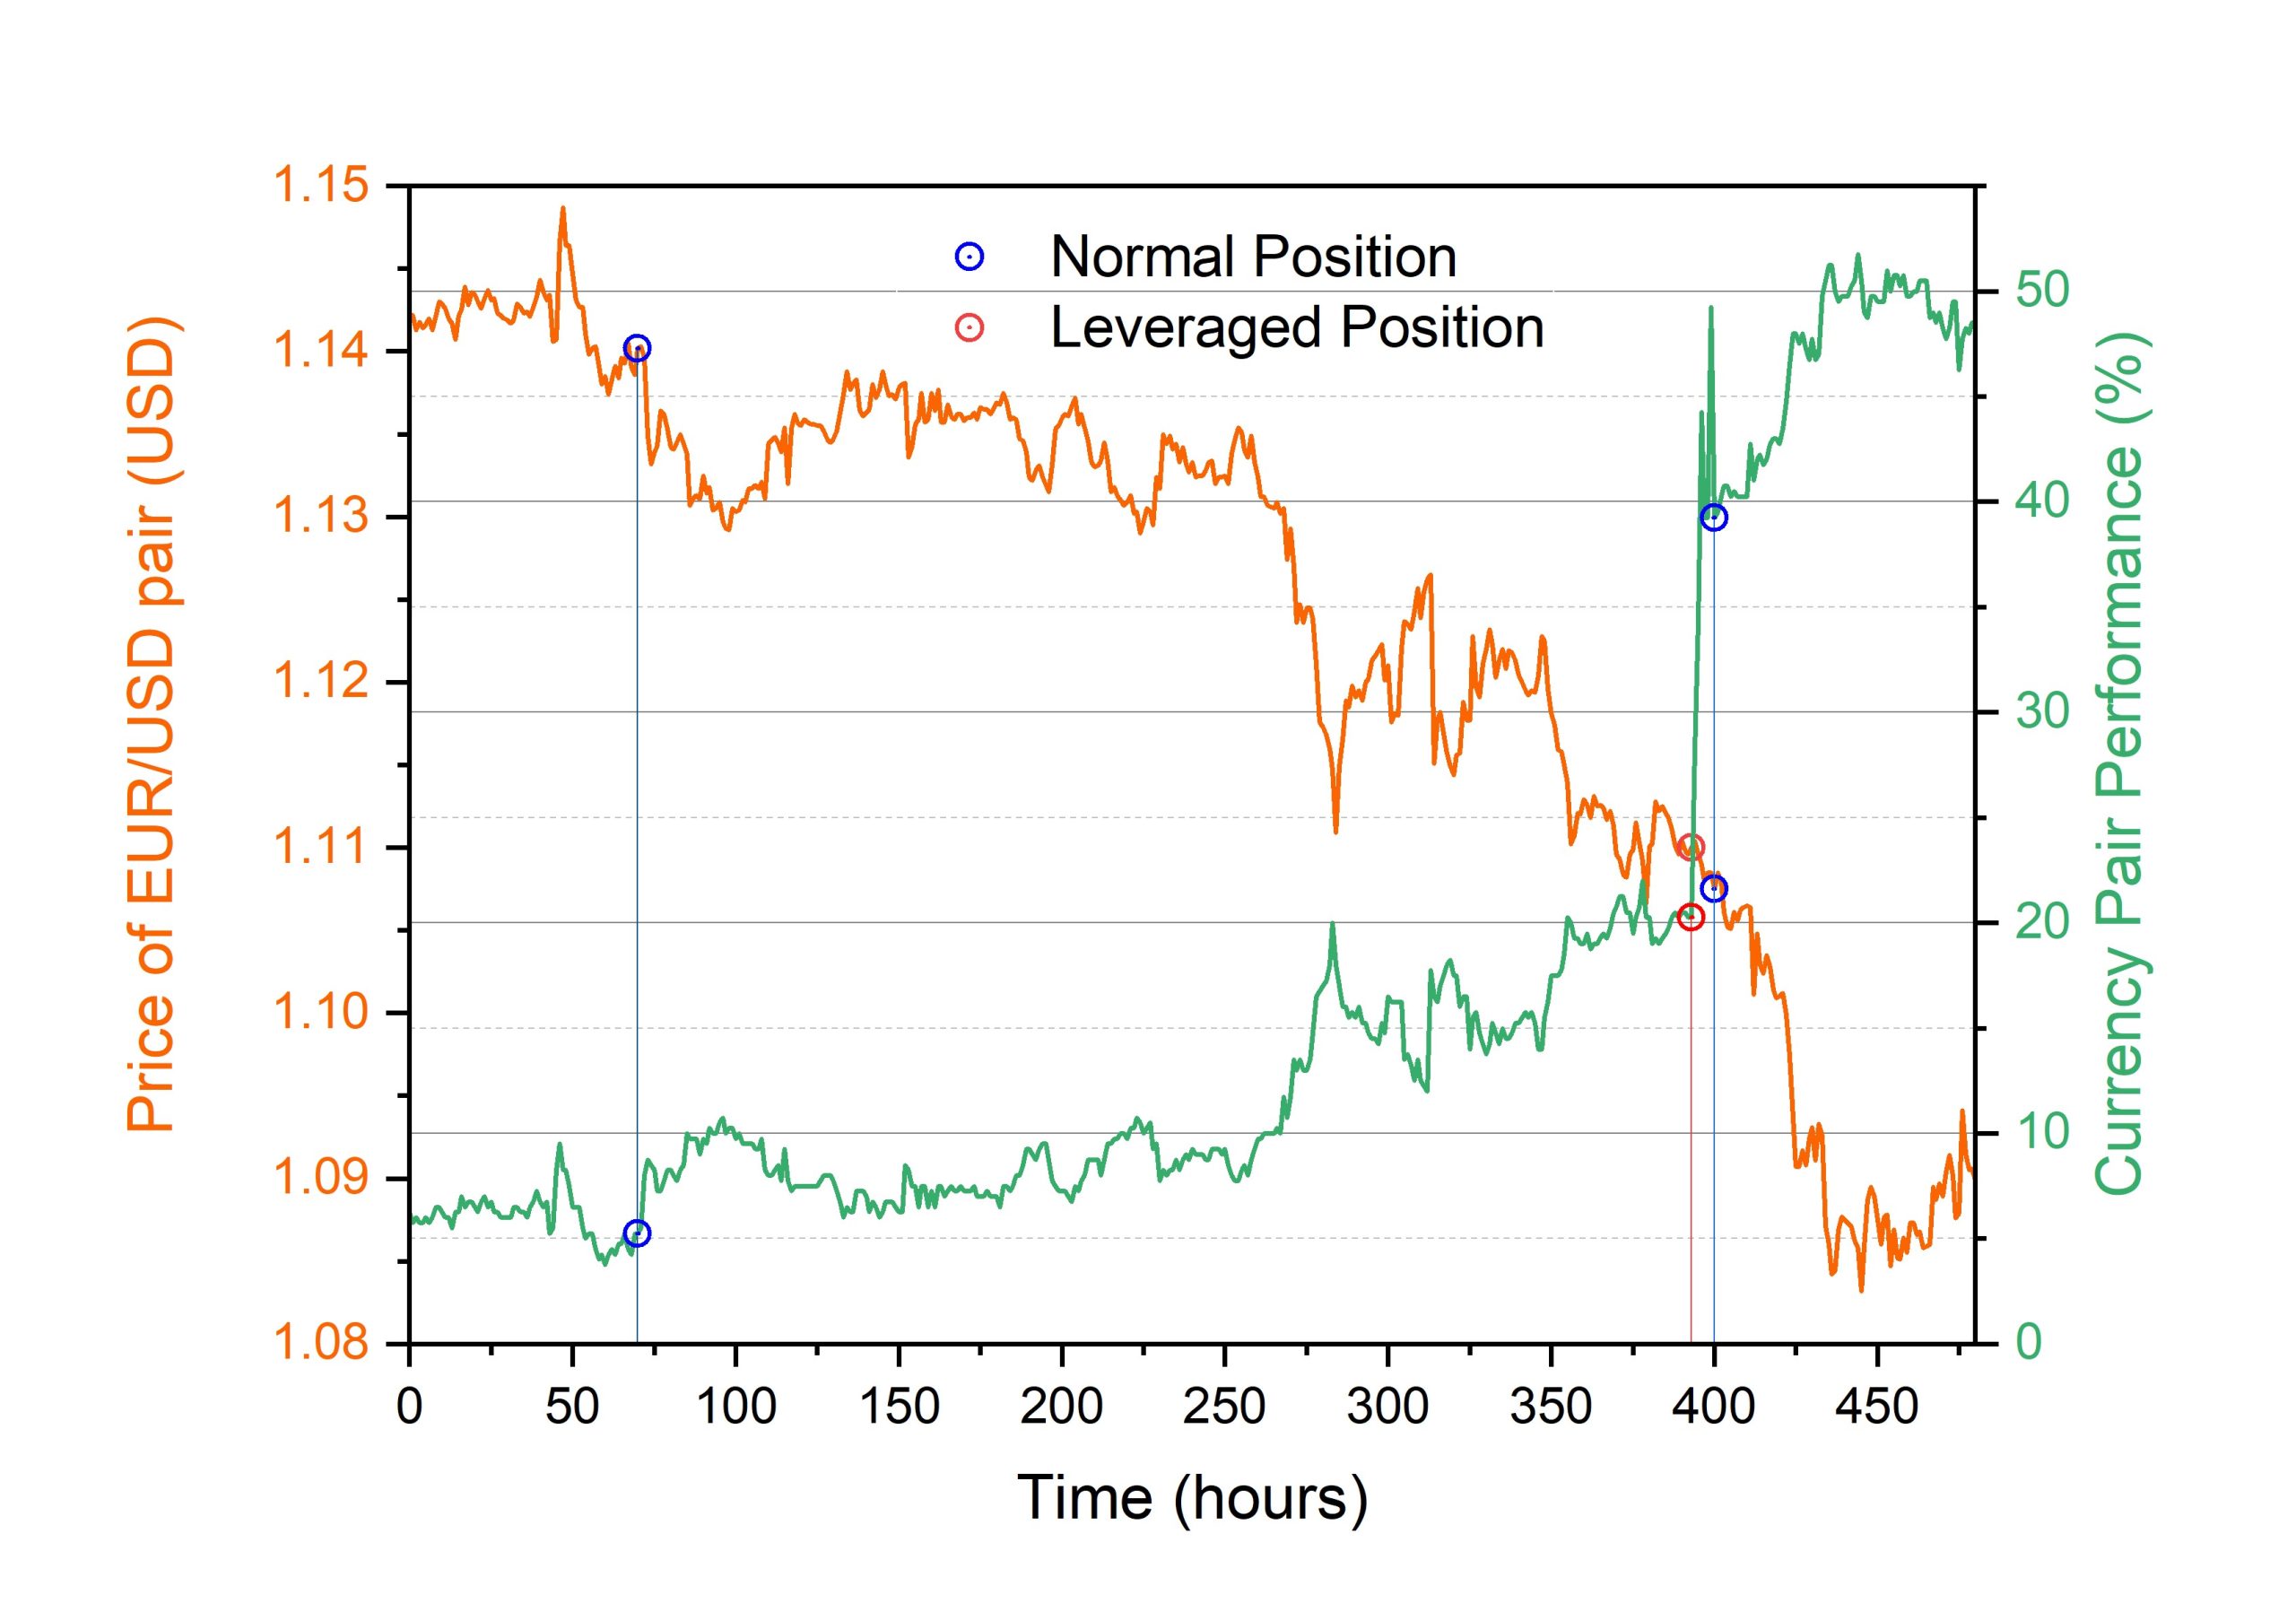
Figure 2: “Short” market Example Graph. The price of the EUR/USD pair (Orange Line) and portfolio performance of the pair (Green Line) is presented for a period of 20 days. Normal (1:1) positions are depicted with blue open circles whilst leveraged (1:20) positions are shown with red open circles.
Figure 2 presents the price of the EUR/USD pair in Euros for a period of 20 days, with an orange line. Meanwhile the performance of our methodology for this currency pair (20% of whole portfolio) is plotted with a green line for the same period. As previously described, the price between the two currencies oscillates, but for this phase it is overall “short”, namely it drops. After around 75 hours our position changed from long to short (blue open circle on the graph), namely we sold the currency at a high price with the anticipation to buy it back at a lower price. This justifies the fact that although the actual price of the currency pair goes down, we make a profit by holding the appropriate position. After ~390 hours following the price trend, the feedback from our analysis confirmed that the conditions had been met to leverage (red open circle on the graph). As in the previous example, our position changed from 1:1 to 1:20 for this currency pair, in this instance for 5 hours, allowing our performance to climb to 50%. The leveraged position then changed back to 1:1, realising a profit of ~48% and therefore the overall increase in the portfolio (100% capital) was just over 9% (1/5th of individual currency pair).

Change Of Market Direction Example

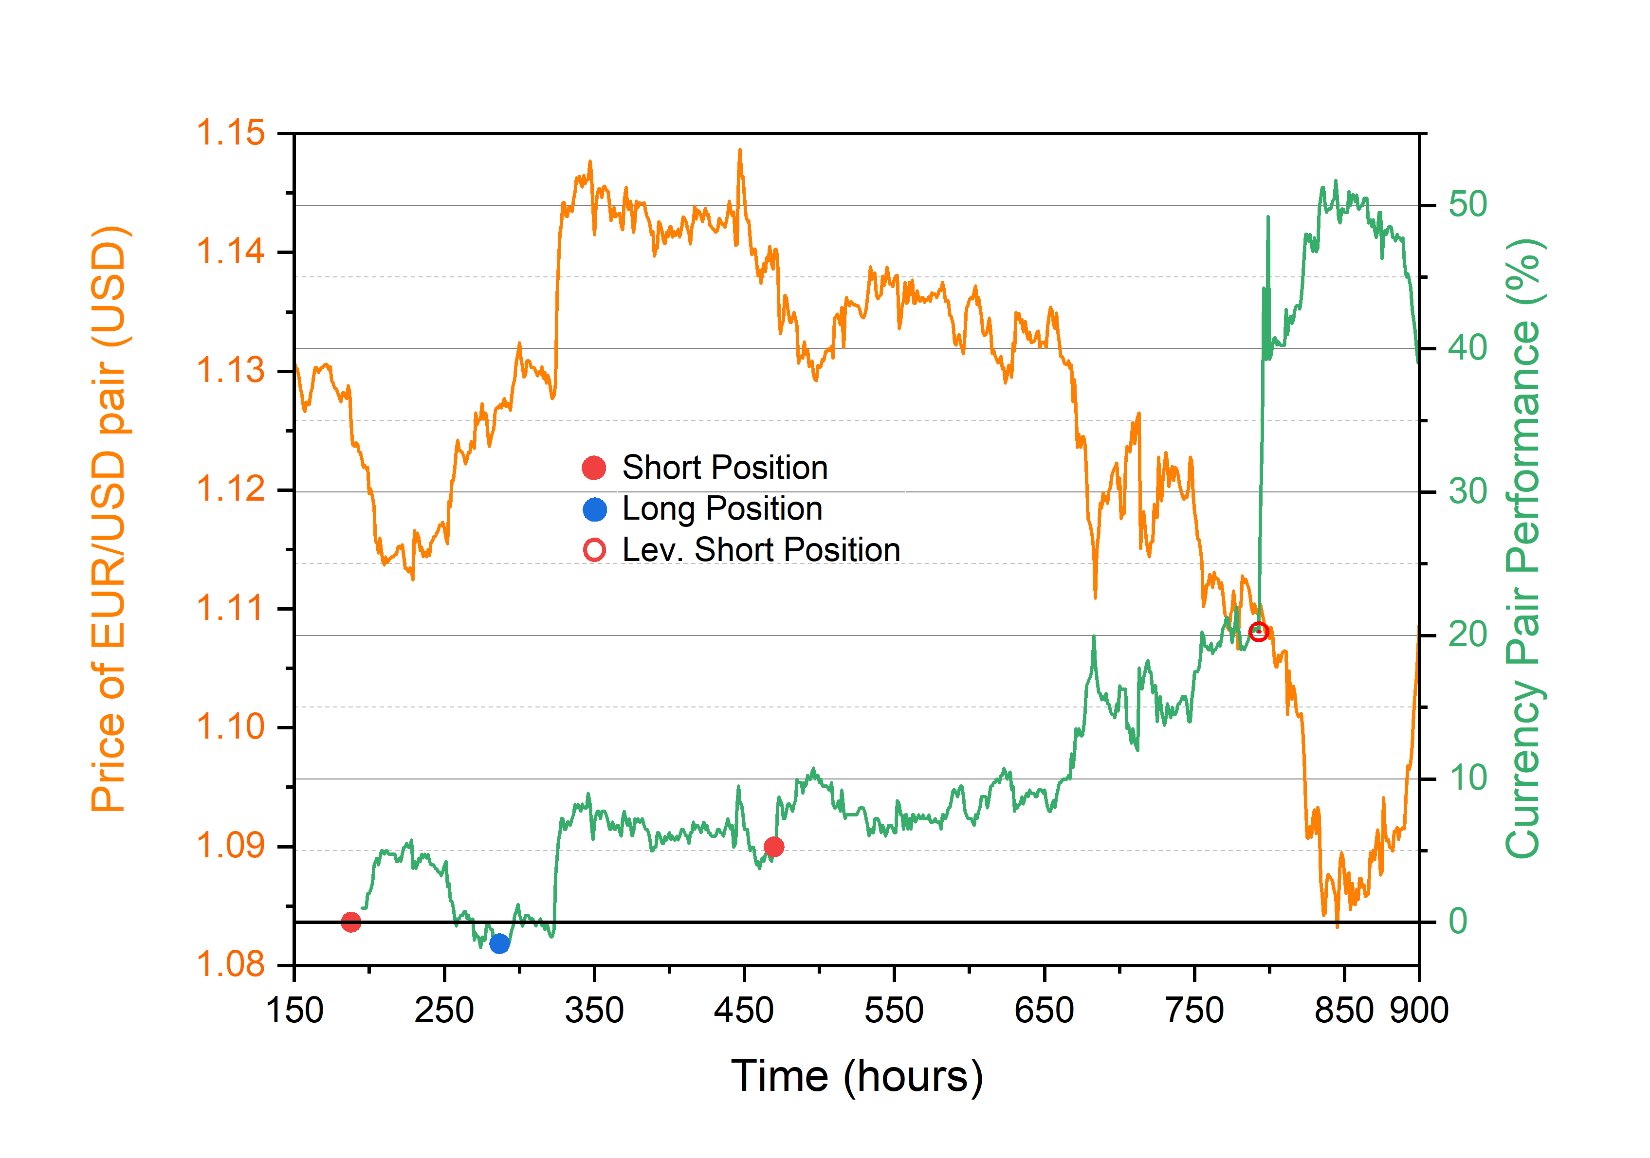
Figure 3: Long to short market Example Graph. The price of the EUR/USD pair (orange Line) and portfolio performance of the pair (Green Line) is presented for a period of ~20 days. Normal long (1:1) positions are depicted with blue circles, normal short (1:1) with red circles, whilst leveraged short (1:20) positions are shown with red open circles.
The Graph (Figure 3) shows with an orange line the change of the price of the EUR/USD currency pair for a period (~20 days). Evidently One can observe the price appreciation of the Euro over the US Dollar, which implies that the currency pair goes “short”. At around 160 hours we open a short position. After the interpretation of our data, we changed our position to long at ~290 hours. The price moved long for a period of ~200 hours after which we changed again direction to short at ~460 hours. As the data shows we stayed short for the rest of the cycle in which we also leveraged, the feedback from our analysis, at ~770 hours as the open red circle denotes.


