Risk refers to potential financial losses from currency exchange rate fluctuations, which can lead to negative performance. Assessing and managing risk is crucial in trading to protect investments and maximize returns.
Market risk assessment involves analyzing economic data, political events, market sentiment, and technical analysis to inform decision-making. Accurate risk assessment allows traders to make informed decisions about trade execution and risk management.
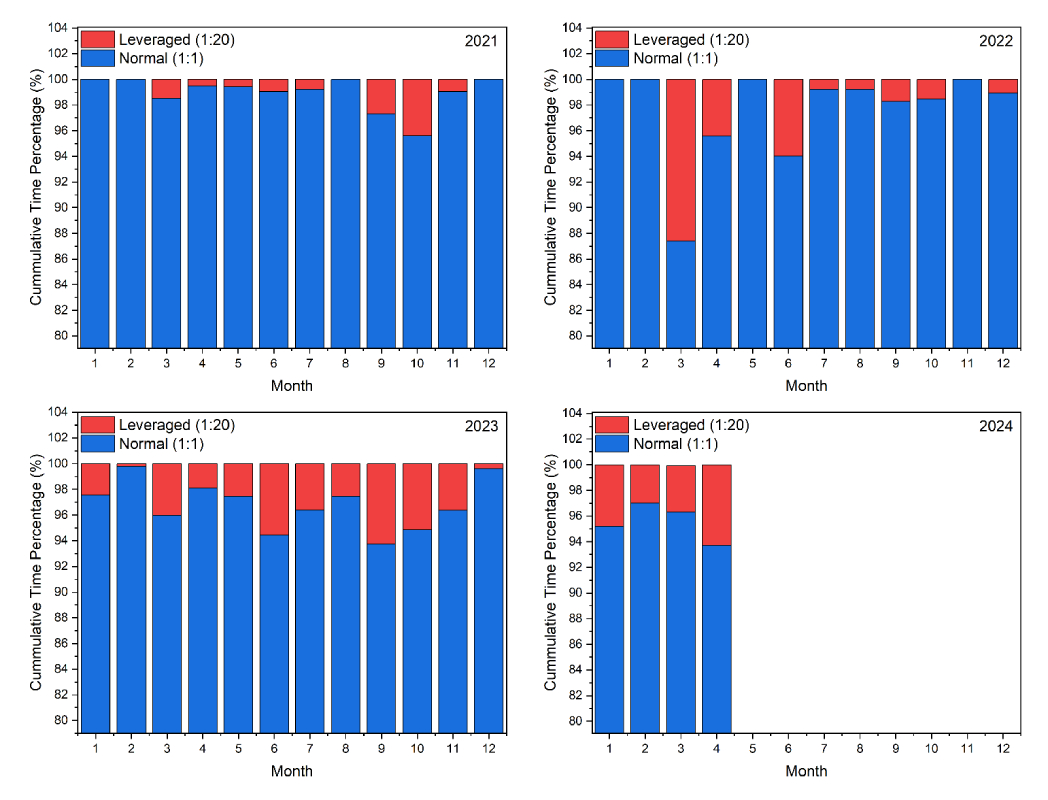
The Strategy trades when all factors align across timeframes and parameters for both unleveraged (1:1) and leveraged (1:20) positions. Risk is minimized by using low leverage (<15% of the trading cycle for all currency pairs combined) during monthly trading cycles, as seen in Figure 4.
Trading activity is limited, mainly at the start of the investment cycle, with adjustments made based on interpreted data. Unleveraged positions remain open for 120 hours per week, with direction changes guided by interpreted data. Exposure to leveraged positions increases briefly.
Data is plotted in 12 graphs, depicting factors like trend waves, strength, and direction. Trades are executed only when all factors align, with a focus on minimizing risk through low leverage usage during short periods, as demonstrated in the following section.
Furthermore, risk assessment plays a vital role in setting realistic expectations and defining risk tolerance levels. It helps traders determine their risk-reward ratio and establish an appropriate stop-loss, namely retaining a limit to the amount they can lose.
The Strategy implements a hard stop-loss discipline of 5%, monthly, to limit potential losses.
Simply put, the Strategy ensures that losses never exceed 5% of the monthly initial capital. If this limit is reached, trading stops, losses are realised, and the Strategy resumes the next month, thus safeguarding the 95% retained capital.
Our collaborators engage in meticulous real-time analysis of results and data to evaluate the performance of the trading methodology. This sophisticated analysis delves into various factors, including the magnitude of losses and the duration of negative impacts. By scrutinizing these metrics with precision, our associates aim to refine the methodology and offer invaluable insights to both current and potential clients.
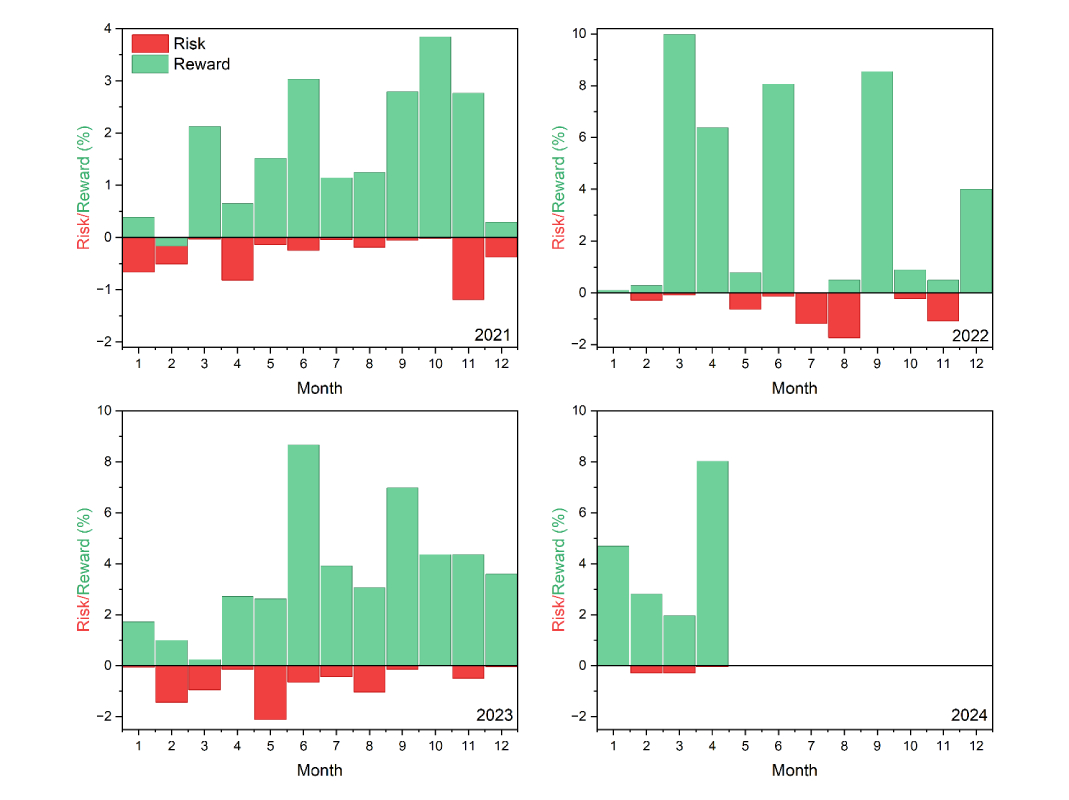
Results from the last 3.5 years of simulated live trading are depicted in Figure 6, showing the risk/return for each investment cycle. Notably, the Strategy's highest risk exposure was -2%, with the lowest realised return being a loss of -0.2%.
Profits and losses are only realised at the end of the month or if the loss limit (5%) is reached. The Strategy's performance during the month is merely a snapshot at that moment and not a realized value.
The trading cycle begins anew each calendar month. While these results are simulated, they form the basis for setting the target performance of 2.5% monthly and implementing the hard stop-loss at 5%.
Cumulative Results
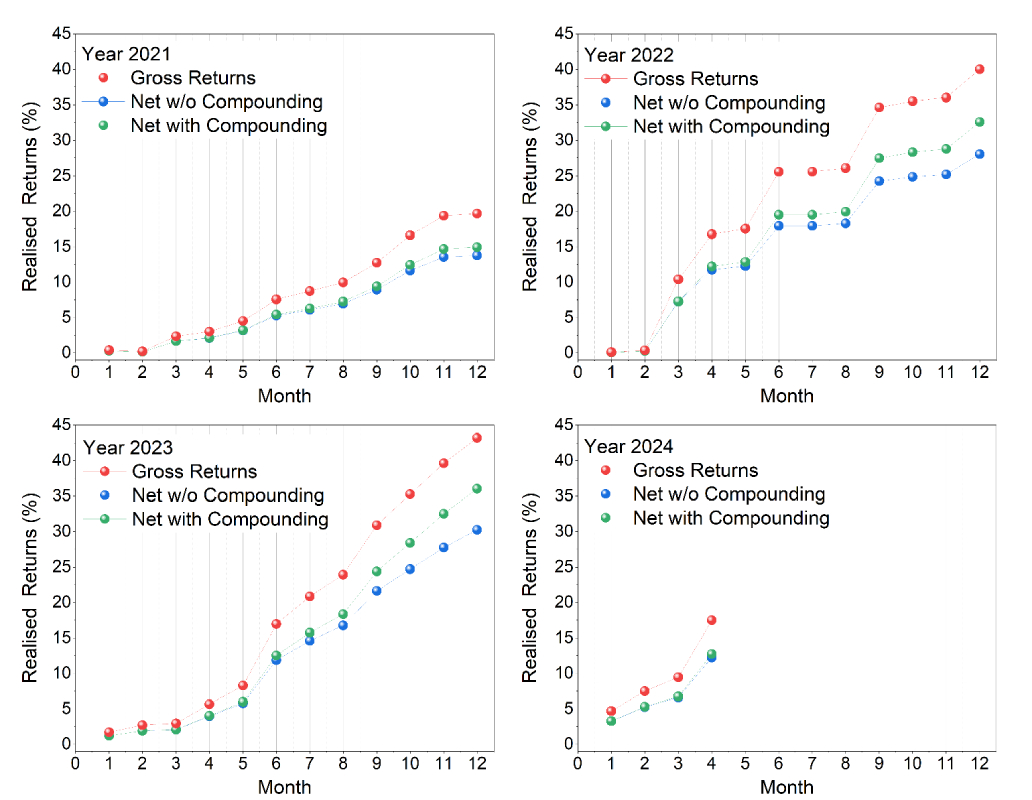
In summary, the cumulative results of the simulated account are shown over a 3.5 year period. Each graph displays the gross performance of the trading methodology with red points.
The second set of points represents the net realized returns, which are the gross profits minus our fees, shown in green (with compounding) and blue (without compounding), on an annual investment cycle basis.
The Product operates on a performance-based fee policy, where clients pay 30% of the gross profits as fees to the Strategy.


